

Bitcoin now almost perfectly aligns with an historically accurate price chart that has charted its growth from pennies to digital gold.
According to data from Digitalik, a resource that monitors bitcoin’s position relative to the Stock-to-Flow model, as of January 20, BTC/USD is exactly where it should be, Cointelegraph reported.
Stock-to-Flow, created by an analyst known as PlanB, measures the bitcoin price using two factors: the stock – the number of bitcoins in circulation – and the flow, which is the number of new bitcoins entering circulation.
Bitcoin’s low emission rate relative to its existing supply – like gold – means Stock-to-Flow constitutes useful evidence in the argument that bitcoin is “digital gold.”
The cryptocurrency’s run-up to $9,000 last week took it slightly over where Stock-to-Flow pricing forecasts suggested it might trade.
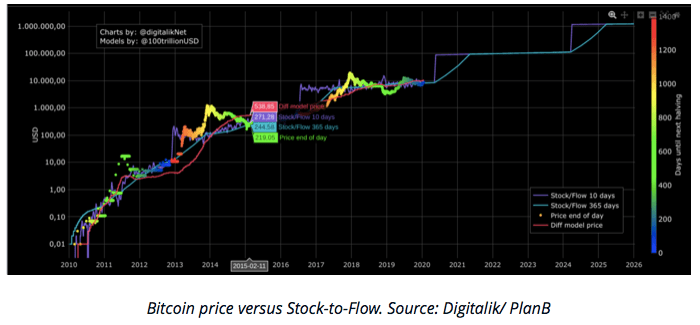
At press time, however, BTC/USD traded at $8,680 – just $150 above the forecasts.
After the block reward halving in May 2020, a 50% reduction in the number of new bitcoins released to miners for each block will further limit the flow versus the existing stock. Thereafter, PlanB said, price performance should accelerate dramatically – by 2022, a single bitcoin should be worth around $100,000.
In 2019, BTC/USD only temporarily diverged from Stock-to-Flow as it hit $13,800, only to fall below expectations for a similarly brief period in December.